
Capital Allowances | Capital Cost Recovery, 2021
25 min readKey Findings
- A capital allowance is the amount of capital investment costs a business can deduct from its revenue through the tax code via depreciation.
- Ideally, countries should provide higher capital allowances, as they can boost business investment which, in turn, spurs economic growth.
- The average of OECD countries’ capital allowances gradually decreased between 2000 and 2017, followed by an increase between 2018 and 2020.
- To incentivize business investment following the COVID-19 pandemic, several OECD countries have implemented accelerated depreciation—and in some cases full expensing—for various asset types.
- Chile now temporarily allows full expensing of fixed assets and 100 percent amortization of intangibles. This makes Chile the third OECD country after Estonia and Latvia that effectively allows full expensing of industrial buildings, machinery, and intangibles.
- Several smaller OECD countries not only allow higher capital allowances but also levy lower corporate income tax rates, making them more attractive for capital investment.
Introduction
The ongoing COVID-19 pandemic has once again highlighted the importance of investment. For example, billions of dollars of investment in the broadband sector made it possible to respond to soaring internet demand when the pandemic first hit. On the other hand, a lack of investment in medical equipment and supplies caused immense difficulties, particularly during the first months of the pandemic. And then, vast amounts of investment in vaccine development and production will likely significantly contribute to eventually ending this pandemic.[1]
Although sometimes overlooked in discussions about corporate taxation, capital cost recovery plays an important role in defining a business’s corporate tax base and can impact these investment decisions—with, as we have seen, far-reaching consequences. When businesses are not allowed to fully deduct capital expenditures in real terms, they make fewer capital investments, which also reduces worker productivity and wages.[2] Thus, businesses should be allowed to fully deduct their capital investments in real terms—either through full expensing or neutral cost recovery.[3]
Capital cost recovery varies greatly across OECD countries, ranging from 100 percent in real terms in Chile, Estonia, and Latvia to only 49.6 percent in New Zealand and 57.0 percent in Japan (covering industrial buildings, machinery, and intangibles). In 2020, nine OECD countries changed their capital allowances, with most of the changes being temporary expansions to boost investment following the COVID-19 pandemic.
On average, businesses in the OECD are able to recover 69.9 percent of the cost of capital investments in real terms. Investments in machinery enjoy the best treatment, with an OECD average of 85.2 percent, followed by intangibles (79.6 percent) and industrial buildings (50.1 percent). In 2000, businesses were able to recover on average 70.3 percent of capital investment costs in the OECD, followed by a gradual decline and then an increase since 2018.
Since 2000, statutory corporate income tax rates have declined significantly across the world and in OECD countries.[4] However, as the average tax treatment of capital investments worsened for most of the last two decades, the benefits of lower statutory rates for investment and growth were partially offset. This broadening of tax bases through lower capital allowances is one of the reasons why corporate tax revenues had been growing or were stable around the world despite declining statutory rates.[5]
The Basics of Depreciation Schedules and Capital Allowances
Before exploring the data more closely, it is worth understanding some of the terminology used in this area of corporate taxation:
- Governments set depreciation schedules to define how businesses can deduct their capital investment costs from their revenues over several years.
- The amount of investment costs a business can deduct in a year is called a capital allowance.
- Full expensing allows businesses to deduct the full cost of a capital investment in the year of acquisition rather than following a multiyear depreciation schedule.
- Accelerated depreciation or bonus depreciation increases capital allowances in earlier years and is often used to stimulate investment during economic downturns.
- Capital cost recovery rates reflect the net present value of capital allowances a business can deduct for a given capital investment over the full depreciation period.
Businesses determine their profits by subtracting costs (such as wages, raw materials, and equipment) from revenue. However, in most jurisdictions, capital investments are not treated like other regular costs that can be subtracted from revenue in the year that the money is spent. Instead, depreciation schedules specify the life span of an asset—often derived from the economic life of an asset—and determine the number of years over which an asset must be written off. By the end of the depreciation period, the business would have deducted the initial dollar cost of the asset.[6] However, in most cases, depreciation schedules do not consider the time value of money (a normal return plus inflation).[7]
Depreciation schedules can be based on different methods, with straight-line depreciation and declining-balance depreciation being the most common. The methods define how annual capital allowances are calculated. While the straight-line method depreciates an asset by an equal allowance each year, the declining-balance method bases the annual allowance on the remaining book value of the asset. (See the Appendix for example calculations.)
Such depreciation schedules define how much of capital investment costs a business can deduct in real terms. For instance, assume a machine costs $10,000 and is subject to a life span of 10 years. Under straight-line depreciation, a business could deduct $1,000 every year for 10 years. However, due to the time value of money, a deduction of $1,000 in later years is not as valuable in real terms as today’s deduction. If inflation is 2 percent and the required real return on investment is 5.5 percent, then at the end of the 10-year period, the value of that last deduction will be just $522 in today’s terms. In total, the business will only be able to deduct $7,379 instead of the full $10,000, just 73.8 percent of the total. This understates true business costs and inflates taxable profits, effectively taxing profits that do not exist.
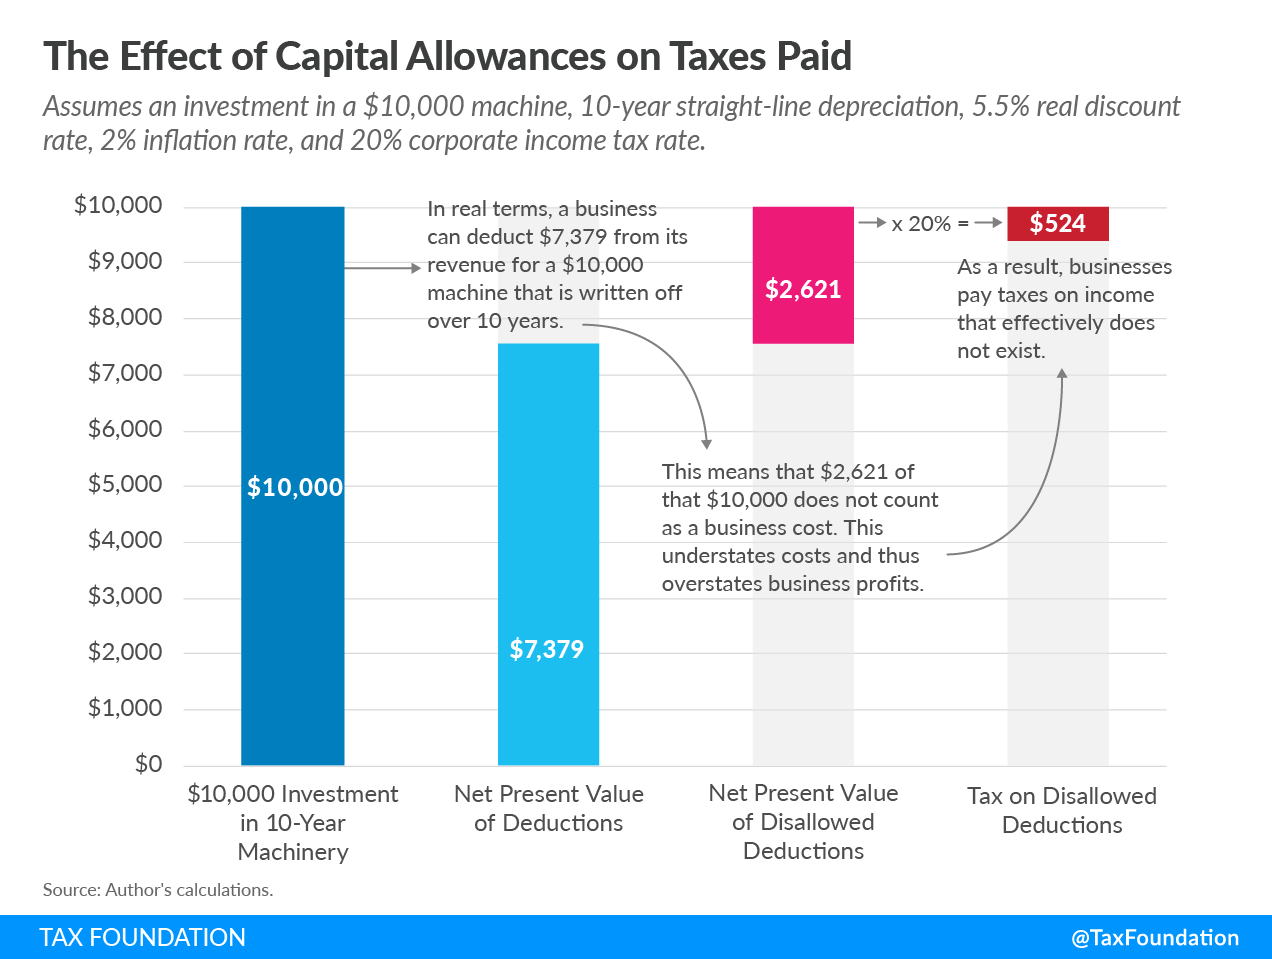
This effect becomes exaggerated with longer depreciation schedules and higher inflation. Lower capital allowances, and thus a higher cost of capital, can lead to a decline in business investment and reductions in the productivity of capital and lower wages.[8]
Capital allowances can be expressed as a percentage of the net present value of investment costs that businesses can write off over the life of an asset—the so-called capital cost recovery rate. A 100 percent capital cost recovery rate represents a business’s ability to deduct the full cost of the investment (including a normal return plus inflation) over its life (e.g., through full expensing or neutral cost recovery). The lower the capital cost recovery rate, the more a business’s taxable income is inflated and the more its tax bill is overstated, making capital investment more expensive.
Capital Allowances and Economic Growth
Although sometimes overlooked as a more technical issue, capital allowances can have important economic impacts. Depending on their structure, they can either boost or slow investment which, in turn, impacts economic growth.
Lower Capital Allowances Lead to Slower Economic Growth
Any cost recovery system that does not allow the full write-off of an investment—full expensing—in the year the investment is made denies recovery of a part of that investment, inflates the taxable income, and increases the taxes paid by businesses.[9] Lower capital allowances increase the cost of capital, which leads to slower investment and a reduction of the capital stock, reducing productivity, employment, and wages.[10]
Prior research has found evidence that investment is sensitive to changes in the cost of capital. Economists Kevin Hassett and R. Glenn Hubbard in a literature review found “a consensus has emerged [among economists] that investment demand is sensitive to taxation.” In other words, as a result of either longer asset lives or a higher corporate income tax rate, the demand for capital decreases and levels of investment decline, reducing the growth in the capital stock.[11] A reduction in the capital stock leads to lower wages for workers and slower economic growth.[12]
In recent years, more empirical results on such investment effects have emerged. A 2017 study by economists Eric Zwick and James Mahon shows that bonus depreciation implemented in the United States raised investment in eligible capital relative to ineligible capital by 10.4 percent between 2001 and 2004 and by 16.9 percent between 2008 and 2010. In addition, their findings showed that small firms respond 95 percent more than large firms.[13]
A study conducted by economists Giorgia Maffini, Jing Xing, and Michael P. Devereux estimates the effect of accelerated depreciation allowances the UK introduced in 2004. Their results show that “the investment rate of qualifying companies increased 2.1-2.5 percentage points relative to those that did not qualify.”[14] Economists Yongzheng Liu and Jie Mao found that China’s switch from a production-based VAT to a consumption-based VAT—meaning there is now an investment tax credit—also had a positive effect on investment.[15]
Unequal Capital Allowances Create a Distortion among Different Investments in the Economy
It is also important to note that capital allowances can distort the relative costs of different investments and thus alter the mix of capital in an economy. A government could lengthen depreciation schedules for machinery, which would slow investment in machinery, harming the manufacturing industry. Likewise, if depreciation schedules are shortened, or if businesses are allowed expensing of machinery, this increase in capital allowances may spur more machinery investment relative to other investment in the country.
Looking at the average capital cost recovery rate in OECD countries by asset type, stark differences are evident. Businesses in the OECD are able to recover on average 85.2 percent of investment costs in machinery and 79.6 percent in intangibles, while only 50.1 percent for buildings.

Tax changes in the United States have given more preferential tax treatment to certain assets than others, which has led to changes in the composition of investment. In 2003, the United States passed the Jobs and Growth Tax Relief Reconciliation Act of 2003 (JGTRRA). Part of this law allowed for partial expensing of certain capital equipment, increasing capital allowances and reducing the cost of certain capital investments by as much as 15 percent.[16] Research on this change found that “investment increased the most for equipment with a longer recovery period and that ‘bonus depreciation had a powerful effect on the composition of investment.’”[17]
If a country cuts its corporate tax rate while limiting capital allowances, it can lead to a shift in the economy from more capital-intensive industries to sectors that rely on less capital investment. This is the case of the UK in the 2010s, which traded longer asset lives for a lower corporate tax rate and saw business investment suffer.[18] The differential treatment of capital-intensive industries over other sectors has likely contributed to the worsening of trends that have revealed significant differences in regional economic output in the UK.[19]
Capital Allowances in the OECD
The treatment of capital allowances varies greatly across OECD countries: The lowest-ranking country, New Zealand, allows its businesses to recover on average only 49.6 percent of capital investment costs, while the highest-ranking countries—Chile, Estonia, and Latvia—allow their businesses to recover 100 percent. This wide range is largely due to countries’ vastly different corporate tax structures, depreciation schemes, and incentives designed to prioritize certain asset types over others.
| Country | Weighted Average Rank | Weighted Average Allowance | Buildings Rank | Buildings Allowance | Machinery Rank | Machinery Allowance | Intangibles Rank | Intangibles Allowance |
|---|---|---|---|---|---|---|---|---|
| Chile (CL) | 1 | 100.0% | 1 | 100.0% | 1 | 100.0% | 2 | 100.0% |
| Estonia (EE) | 1 | 100.0% | 1 | 100.0% | 1 | 100.0% | 2 | 100.0% |
| Latvia (LV) | 1 | 100.0% | 1 | 100.0% | 1 | 100.0% | 2 | 100.0% |
| Lithuania (LT) | 4 | 88.2% | 4 | 82.7% | 8 | 90.5% | 5 | 96.6% |
| Iceland (IS) | 5 | 74.7% | 5 | 60.2% | 18 | 86.0% | 18 | 81.2% |
| France (FR) | 6 | 74.2% | 8 | 54.8% | 11 | 88.0% | 8 | 87.0% |
| Switzerland (CH) | 7 | 74.1% | 7 | 55.5% | 18 | 86.0% | 7 | 90.5% |
| Korea (KR) | 8 | 74.0% | 8 | 54.8% | 7 | 92.2% | 21 | 73.8% |
| Slovakia (SK) | 9 | 73.9% | 8 | 54.8% | 12 | 87.4% | 8 | 87.0% |
| Finland (FI) | 10 | 73.4% | 15 | 51.9% | 6 | 93.5% | 21 | 73.8% |
| Czech Republic (CZ) | 11 | 73.3% | 14 | 54.3% | 12 | 87.4% | 15 | 84.1% |
| Austria (AT) | 12 | 73.2% | 6 | 56.7% | 10 | 88.4% | 21 | 73.8% |
| Portugal (PT) | 13 | 72.6% | 8 | 54.8% | 9 | 88.8% | 21 | 73.8% |
| Luxembourg (LU) | 14 | 71.0% | 16 | 47.9% | 14 | 87.1% | 8 | 87.0% |
| Sweden (SE) | 15 | 70.3% | 16 | 47.9% | 18 | 86.0% | 14 | 86.0% |
| Belgium (BE) | 16 | 70.0% | 8 | 54.8% | 32 | 73.8% | 1 | 100.5% |
| Canada (CA) | 17 | 68.8% | 24 | 42.6% | 1 | 100.0% | 37 | 49.0% |
| Denmark (DK) | 18 | 68.2% | 16 | 47.9% | 24 | 82.7% | 17 | 81.3% |
| United States (US) | 19 | 67.7% | 31 | 35.0% | 1 | 100.0% | 34 | 63.3% |
| Italy (IT) | 20 | 66.8% | 22 | 46.3% | 30 | 76.0% | 6 | 96.5% |
| Germany (DE) | 21 | 66.3% | 25 | 39.1% | 23 | 84.7% | 8 | 87.0% |
| Israel (IL) | 22 | 66.1% | 25 | 39.1% | 15 | 87.0% | 19 | 78.7% |
| Turkey (TR) | 22 | 66.1% | 23 | 43.1% | 17 | 86.4% | 32 | 69.4% |
| Mexico (MX) | 24 | 66.0% | 8 | 54.8% | 32 | 73.8% | 21 | 73.8% |
| Australia (AU) | 25 | 65.3% | 16 | 47.9% | 22 | 85.1% | 35 | 54.8% |
| Slovenia (SI) | 25 | 65.3% | 25 | 39.1% | 15 | 87.0% | 21 | 73.8% |
| Norway (NO) | 27 | 64.2% | 30 | 37.4% | 18 | 86.0% | 21 | 73.8% |
| Ireland (IE) | 28 | 63.9% | 16 | 47.9% | 27 | 78.7% | 33 | 64.6% |
| Greece (GR) | 29 | 63.1% | 16 | 47.9% | 32 | 73.8% | 21 | 73.8% |
| United Kingdom (GB) | 30 | 61.8% | 25 | 39.1% | 31 | 75.9% | 16 | 82.7% |
| Spain (ES) | 31 | 61.3% | 25 | 39.1% | 28 | 77.9% | 21 | 73.8% |
| Netherlands (NL) | 32 | 60.7% | 32 | 33.8% | 26 | 81.3% | 21 | 73.8% |
| Poland (PL) | 33 | 59.3% | 32 | 33.8% | 32 | 73.8% | 8 | 87.0% |
| Hungary (HU) | 34 | 58.3% | 35 | 27.9% | 25 | 81.6% | 21 | 73.8% |
| Colombia (CO) | 35 | 58.0% | 34 | 30.6% | 32 | 73.8% | 8 | 87.0% |
| Japan (JP) | 36 | 57.0% | 35 | 27.9% | 29 | 77.0% | 19 | 78.7% |
| New Zealand (NZ) | 37 | 49.6% | 37 | 22.6% | 37 | 73.2% | 35 | 54.8% |
| OECD Average | 69.9% | 50.1% | 85.2% | 79.6% | ||||
|
Notes: To calculate the net present values, a fixed discount rate of 7.5 percent is assumed (fixed inflation rate of 2 percent and fixed real discount rate of 5.5 percent). Weighted averages are weighted by an estimate of each asset’s respective share of the capital stock (machinery: 44 percent, industrial buildings: 41 percent, and intangibles: 15 percent). *Belgium has an additional investment allowance that allows for a 113.5 percent depreciation of intangibles, translating to 100.5 percent in net present value terms. Sources: Christoph Spengel, Frank Schmidt, Jost Heckemeyer, and Katharina Nicolay, “Effective Tax Levels Using the Devereux/Griffith Methodology,” European Commission, October 2020, https://ec.europa.eu/taxation_customs/sites/taxation/files/final_report_2020_effective_tax_levels_revised_en.pdf; Bloomberg Tax, “Country Guides,” https://www.bloomberglaw.com/product/tax/toc_view_menu/3380/node/3380; EY, “Worldwide Capital and Fixed Assets Guide 2020,” Aug. 27, 2020, https://www.ey.com/en_gl/tax-guides/worldwide-capital-and-fixed-assets-guide-2020; EY, “Worldwide Corporate Tax Guide 2020,” July 22, 2020, https://www.ey.com/en_gl/tax-guides/worldwide-corporate-tax-guide-2020; PwC, “Worldwide Tax Summaries,” https://taxsummaries.pwc.com/; and author’s calculations. |
||||||||
Investment in industrial buildings has relatively poor tax treatment in the OECD, with an average allowance of only 50.1 percent. Chile, Estonia, and Latvia have the best treatment of industrial buildings at 100 percent. Chile implemented temporary full expensing for all assets in 2020, and Estonia and Latvia operate cash-flow tax systems. The countries with the lowest capital cost recovery rates for industrial buildings are New Zealand (22.6 percent), Hungary (27.9 percent), and Japan (27.9 percent).
Machinery generally has the best tax treatment, with an OECD average allowance of 85.2 percent. Canada, Chile, and the United States are currently above average, at 100 percent, due to temporary full expensing of investments in machinery. Estonia and Latvia also have full cost recovery of investments in machinery, again due to their cash-flow tax systems. The country with the worst tax treatment of investments in machinery is New Zealand, with an allowance of only 73.2 percent.
The average capital allowance for intangibles is 79.6 percent in OECD countries. Due to an additional investment allowance, Belgium’s treatment of investments in intangibles is the most generous, at 100.5 percent. Chile, Estonia, and Latvia follow, at 100 percent. Canada has the worst tax treatment of investments in intangibles, at 49 percent, followed by Australia (54.8 percent), New Zealand (54.8 percent), and the United States (63.3 percent).
The following map shows that the extent to which businesses can deduct their capital investment costs varies greatly across Europe.

Capital Allowances and COVID-19
To spur capital investment during economic downturns, policymakers often temporarily increase the capital allowances businesses can claim. Several OECD countries have done so in response to the pandemic-induced economic crisis.
- Australia implemented two temporary depreciation measures in the first half of 2020 that apply to all businesses with revenues below AU $500 million (US $350 million), namely an instant asset write-off (full expensing) for depreciating assets that cost less than AU $150,000 (up from AU $30,000) and an accelerated depreciation deduction for all depreciable assets that are not eligible for the instant write-off. At the end of 2020, Australia implemented temporary full expensing for most assets (excluding buildings) for businesses with revenues below AU $5 billion (US $4 billion).[20]
- Austria accelerated depreciation for buildings in the first two years and allows businesses to depreciate machinery at a higher rate using the declining-balance method. No end date for these accelerated depreciation methods has been set so far.
- Chile now allows full expensing of fixed assets—such as buildings and machinery—and 100 percent amortization of intangibles until the end of 2022, making it the third OECD country after Estonia and Latvia that effectively provides full expensing for industrial buildings, machinery, and intangibles.
- Finland doubled its declining-balance depreciation rate for machinery from 25 percent to 50 percent for the years 2020 to 2023.
- Germany accelerated depreciation schedules for machinery for the years 2020 and 2021.
- New Zealand permanently reintroduced depreciation for commercial and industrial buildings with an estimated useful life of 50 years or more and temporarily increased the threshold for low-value assets that qualify for immediate write-off.
- Norway increased its declining-balance depreciation rate from 20 to 30 percent for machinery acquired or improved between July and December of 2020.
- The United Kingdom permanently reintroduced depreciation for industrial buildings at 2 percent in 2019 and expanded it to 3 percent in 2020. In addition, as part of the 2021 budget, the UK significantly increased capital allowances: Between April 1, 2021 and March 31, 2023, businesses can deduct 130 percent of the investment costs in plant and equipment and 50 percent for other investments, including integral features to buildings.[21]
Changes unrelated to COVID-19:
- Belgium made its capital allowance provisions less generous starting January 1, 2020; it changed its depreciation method for buildings and machinery from declining-balance to straight line.
While the temporary nature of most of these expensing and accelerated depreciation provisions reduces their tax revenue impact in the long run, it also limits their long-run economic benefits. Temporary provisions may encourage businesses to shift future investments forward to take advantage of the larger deductions but would not raise the level of investment permanently. Thus, permanent full expensing across all asset types—rather than targeted temporary measures—would yield the highest economic benefits.[22]
Capital Allowances in Selected OECD Countries
Capital cost recovery—as reflected in Table 1 above—varies significantly across OECD countries. The following examples highlight some of the differences and recent developments.
Estonia and Latvia: Cash-Flow Tax
Estonia and Latvia have both replaced their traditional corporate income tax systems with a cash-flow tax model, which allows for a capital cost recovery rate of 100 percent. Rather than requiring corporations to calculate their taxable income using complex rules and depreciation schedules on an annual basis, the Estonian and Latvian corporate income tax of 20 percent is levied only when a business distributes profits to shareholders.
This not only simplifies the calculation of taxable profit, but it also allows for treatment of capital investment that is equivalent to full expensing. Since distributed profits are the tax base, there is no need for depreciation schedules. Instead, capital costs reduce profits in the year of investment. This treatment of capital investment encourages businesses in Estonia and Latvia to use their profits to reinvest in their firms rather than distribute them to shareholders, leading to new capital formation and increased economic growth.
Canada and the United States: Temporary Expensing for Equipment and Machinery
Currently, the United States tax code allows businesses to recover 67.7 percent of capital investment costs on average. This is slightly below the OECD average of 69.9 percent.
The U.S. capital allowance for intangibles is 63.3 percent, lower than the OECD average of 79.6 percent. Cost recovery of nonresidential structures is also low in the U.S., at an allowance of only 35 percent over their rather long 39-year asset lives, while the OECD average is 50.1 percent.
For machinery, the U.S. currently has a 100 percent capital cost recovery rate due to temporary full expensing provided by the Tax Cut and Jobs Act (TCJA). The OECD has an average of 85.2 percent for capital allowances for machinery. Notably, the OECD highlighted the U.S. provision in its 2018 Economic Survey of the United States, pointing out that the policy “will likely give a substantial boost to investment activity.”[23]
As a response to full expensing for machinery in the U.S., Canada adopted full expensing for equipment and machinery used in the manufacturing and processing of goods, and for clean energy investments.[24] These assets may be fully written off in the year the equipment or machinery is put into use, instead of being depreciated over several years.
Canada also adopted accelerated depreciation schedules for nonresidential buildings.[25] Businesses that invest in buildings used in manufacturing and processing will be able to write off 15 percent of the cost in the first year (up from 5 percent) and first-year write-offs for investments in other nonresidential buildings have been increased from 3 percent to 9 percent.
The TCJA provides full expensing only through 2021 and phases it out over the 2022 to 2026 period; Canada’s enhanced deductions will be in place until 2023, with a gradual phaseout period between 2024 and 2027. Although these reforms will temporarily boost investment activity, long-term effects would be significantly higher if the changes were made permanent parts of both tax systems.[26]
Capital Cost Recovery in the OECD since 2000
The simple average of OECD countries’ capital cost recovery rates decreased between 2000 and 2017, followed by a slight increase in 2018 and 2019,[27] and then a significant jump in 2020 as a response to the COVID-19 pandemic. While OECD countries allowed their businesses to deduct on average approximately 70.3 percent of their capital investments in 2000, this number decreased to 66.6 percent in 2017, and now stands at 69.9 percent.
Weighted by GDP, the average OECD capital cost recovery rate declined slightly between 2000 and 2017, ranging from 65.2 percent in 2000 to 63.5 percent in 2017. Full expensing for machinery in Canada and the United States, the UK’s reintroduction of capital allowances for buildings, and newly introduced accelerated depreciation across asset types in several OECD countries due to the COVID-19 pandemic have significantly raised the weighted average in the last three years; in 2020, it stood at 66.6 percent.
As Figure 3 shows, the OECD average capital cost recovery rate weighted by each country’s GDP is consistently lower than the simple OECD average. This is because smaller economies tend to have better tax treatment of capital investment. This is also reflected in our ranking (see Table 1): Chile, Estonia, Latvia, Lithuania, and Iceland, all relatively small economies, are the countries with the best tax treatment of capital investments.

Corporate Income Tax Rates in the OECD
More attention is generally paid to the corporate income tax rate, rather than the income tax base. However, the corporate income tax base and the corporate income tax rate are both important in determining businesses’ effective tax levels. Similar to low capital allowances, a high corporate income tax rate reduces corporations’ after-tax profits, increases the cost of capital, and slows the growth of the capital stock. This can lead to lower productivity, lower wages, and slower economic growth.[28]
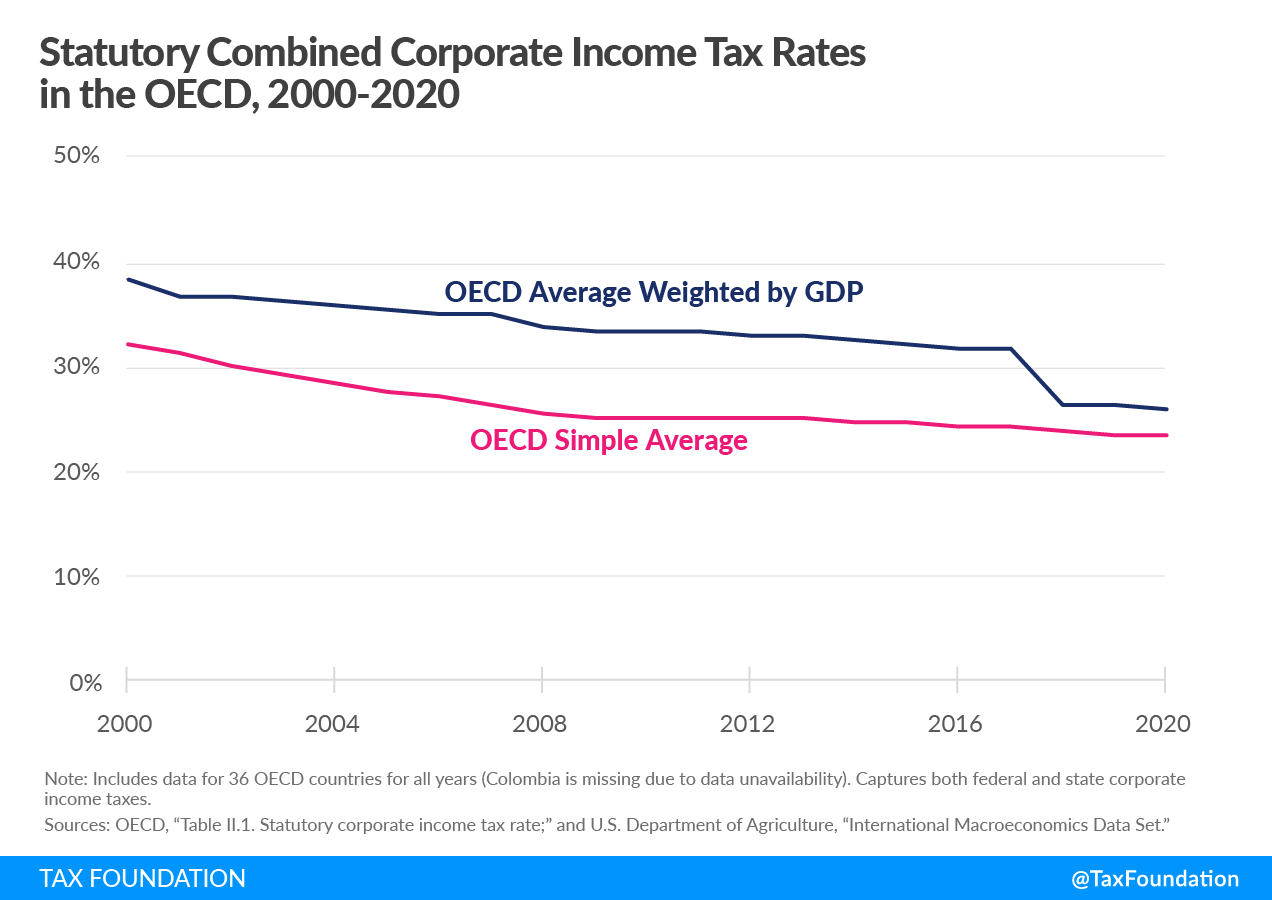
In the past 20 years, countries throughout the OECD have repeatedly reduced their statutory corporate income tax rates, pushing the average rate in OECD countries to approximately 23.3 percent in 2020.[29] The OECD average of corporate income tax rates weighted by each country’s GDP has also decreased since 2000, with a significant decline between 2017 and 2018 due to the cut in U.S. corporate income tax from about 39 percent to 26 percent.
Similar to capital allowances, the OECD average of corporate income tax rates weighted by each country’s GDP is consistently higher than the simple OECD average. This implies that some smaller countries tend to not only have higher capital allowances but also lower corporate income tax rates, making them more competitive from a tax perspective than some larger economies.
Conclusion
Although it has been important to reduce the distortionary effects of corporate income taxes by lowering statutory rates around the world, doing so without also considering capital allowances misses an important point of sound tax policy. Low capital allowances reduce incentives to invest, leading to lower wages and slower economic growth.
Besides pursuing policies of full expensing for capital investments, it is also important to make capital allowance provisions permanent. Permanency implies certainty, which is an essential factor especially for long-term investment decisions. For instance, the new temporary Canadian and U.S. expensing and accelerated depreciation provisions are likely to spur economic growth in the short term. Their long-term effects, however, would be much higher if the changes were made permanent.
To address the economic fallout of the COVID-19 pandemic, several OECD countries have temporarily accelerated depreciation schedules for various assets, and Chile implemented full expensing for buildings, machinery, and intangibles. Estonia and Latvia have taken the lead in permanently ensuring their corporate tax codes do not pose a barrier to investment and growth, setting an example for other countries to follow.
Appendix
Calculating Capital Allowances: Straight-Line Method
| Year | Remaining Value of Fixed Asset | Nominal Write-off | Net Present Value Write-off |
|---|---|---|---|
| 0 | $ 100.00 | $ 12.50 | $ 12.50 |
| 1 | $ 87.50 | $ 12.50 | $ 11.63 |
| 2 | $ 75.00 | $ 12.50 | $ 10.82 |
| 3 | $ 62.50 | $ 12.50 | $ 10.06 |
| 4 | $ 50.00 | $ 12.50 | $ 9.36 |
| 5 | $ 37.50 | $ 12.50 | $ 8.71 |
| 6 | $ 25.00 | $ 12.50 | $ 8.10 |
| 7 | $ 12.50 | $ 12.50 | $ 7.53 |
| Total Value: | $ 100.00 | $ 78.71 | |
| Total Allowance: | 100% | 78.71% | |
|
Note: 8-year Straight-Line Method at 12.5 percent. Real discount rate of 5.5 percent, inflation of 2 percent. Source: Author’s calculations. |
|||
Appendix Table 1 illustrates the calculation of a capital allowance using the straight-line method. Suppose a business made a capital investment of $100 and assume a real discount rate plus inflation that equals 7.5 percent.
In this example, the government allows investment in machinery to be deducted on a straight-line method of 12.5 percent for eight years. This means the business can deduct 12.5 percent of the initial cost of an investment each year for eight years.
Every year, the business can deduct 12.5 percent ($12.50) of the initial investment from taxable income. In the first year, the nominal value equals the present value of the write-off. However, over time, the present value of each year’s write-off declines due to the time value of money.
Although the nominal value of the entire write-off is $100, the present value is only $78.71. As a result, the company can only recover 78.71 percent of the present value of the cost of the machine by the end of the period.
Calculating Capital Allowances: Declining-Balance Method
| Year | Remaining Value of Fixed Asset | Nominal Write-off | Net Present Value Write-off |
|---|---|---|---|
| 0 | $ 100.00 | $ 20.00 | $ 20.00 |
| 1 | $ 80.00 | $ 16.00 | $ 14.88 |
| 2 | $ 64.00 | $ 12.80 | $ 11.08 |
| 3 | $ 51.20 | $ 10.24 | $ 8.24 |
| 4 | $ 40.96 | $ 8.19 | $ 6.13 |
| 5 | $ 32.77 | $ 6.55 | $ 4.56 |
| 6 | $ 26.21 | $ 5.24 | $ 3.40 |
| 7 | $ 20.97 | $ 20.97 | $ 12.64 |
| Total Value: | $ 100.00 | $ 80.94 | |
| Total Allowance: | 100% | 80.94% | |
|
Note: 8-year Declining-Balance Method at 20 percent plus final year. Real discount rate of 5.5 percent, inflation of 2 percent. Source: Author’s calculations. |
|||
Appendix Table 2 illustrates the calculation of a capital allowance using the declining-balance method. Suppose a business made a capital investment of $100 and assume a real discount rate plus inflation that equals 7.5 percent.
Also suppose the government allows investment in machinery to be deducted on a declining balance method of 20 percent for eight years. This means the business can deduct 20 percent of the remaining cost of an investment each year for eight years.
In the initial year, the business can deduct 20 percent ($20) of the initial investment from taxable income. That $20 is subtracted from the initial value of the machine. The next year, the machine has a remaining value of only $80 (the initial $100 minus the 20 percent deduction in the initial year) and, once again, 20 percent, or $16, is deducted from taxable income and subtracted from the value of the machine. In the next year, another 20 percent is deducted from the remaining $64 value of the machine, or $12.80. This method continues until the final year, when the remaining $20.97 of the investment is deducted.
Over time, the net present value of each year’s write-off declines due to the time value of money (real discount rate plus inflation). Although the nominal value of the entire write-off is $100, the present value is only $80.94. As a result, the company can only recover 80.94 percent of the present value of the cost of the machine by the end of the period.
Countries with Unique Depreciation Schedules
While most OECD countries follow either the straight-line or declining-balance depreciation methods (or a combination of both) to determine annual capital allowances, there are some notable exceptions. The Czech Republic and Slovakia have unique depreciation schedules, and Mexico allows businesses to adjust their capital allowances for inflation.
Czech Republic and Slovakia: Specific Accelerated Depreciation Method
Besides the straight-line method, businesses may elect to depreciate buildings (only in the Czech Republic[30]) and machinery (in both countries) using a specific accelerated method. Under this method, depreciation for the first year is calculated by dividing the cost of the asset by the number of years reflecting the useful life of an asset. For subsequent years, accelerated depreciation is calculated by multiplying the residual tax value of the asset by two and then dividing it by the remaining years of depreciation plus one year.[31]
Despite this comparably complex calculation of depreciation values, Slovakia ranks ninth (73.9 percent) and the Czech Republic eleventh (73.3 percent) in our comparison of capital cost recovery in the OECD, making them attractive places for business investment.
Mexico: Inflation-Adjustment for Capital Allowances
Businesses in Mexico are allowed to adjust their capital allowances for inflation—a unique feature among OECD countries’ depreciation methods.[32] This allows businesses to recover a larger share of their investment costs in real terms than they otherwise would, making it a partial form of neutral cost recovery. Such inflation adjustments reduce the negative impact of long depreciation schedules on investment incentives and economic growth.
CCTB and Capital Cost Allowances in EU Countries
In 2016, the European Commission (EC) proposed several directives for reforming corporate taxation for European Union (EU) member states. One of these proposals is the Common Corporate Tax Base (CCTB). The goal of the CCTB directive is to unify definitions of the corporate tax base across the EU. It is part of a general effort to shift specific areas of tax policy from individual member states to the EU. Currently, each EU member state has veto power over many tax proposals from the EC, and the CCTB has not yet been adopted.
A compromise proposal for CCTB was released in June 2019 and provides details for how the tax base would be defined.[33] Among other aspects of corporate tax base harmonization, the document provides information on capital allowances. Under this compromise proposal for CCTB, businesses would be able to deduct the cost of their assets over their defined useful lives on a straight-line basis. Six specific asset categories and associated lives are defined in the proposal.[34]
The net present value of the capital allowances can be estimated using similar methods as those used for individual countries. On average across the three general asset categories of buildings, machinery, and intangibles, the net present value of capital allowances under the CCTB compromise is 67.3 percent. This is lower than in 15 of the current EU member states and higher than in 12 EU member states.

This comparison shows that the CCTB would be less pro-growth than the tax bases of many EU countries, especially some smaller EU member states.[35] Although there are many other facets to the CCTB debate, it is important to note that the EU should pursue a tax base that is pro-growth rather than one that penalizes business investment.[36]
[1] The Progressive Policy Institute has compiled a list of the 25 top investors in the United States. See Michael Mandel and Elliott Long, “Investment Heroes 2020,” Progressive Policy Institute, July 24, 2020, https://www.progressivepolicy.org/blogs/investment-heroes-2020/.
[2] Stephen J. Entin, “The Tax Treatment of Capital Assets and Its Effect on Growth: Expensing, Depreciation, and the Concept of Cost Recovery in the Tax System,” Tax Foundation, Apr. 24, 2013, https://www.taxfoundation.org/tax-treatment-capital-assets-and-its-effect-growth-expensing-depreciation-and-concept-cost-recovery/.
[3] Stephen J. Entin, “The Neutral Cost Recovery System: A Pro-Growth Solution for Capital Cost Recovery,” Tax Foundation, Oct. 29, 2013, https://www.taxfoundation.org/article/neutral-cost-recovery-system-pro-growth-solution-capital-cost-recovery.
[4] OECD, “Table II.1. Statutory corporate income tax rate,” updated April 2020, https://www.stats.oecd.org/Index.aspx?DataSetCode=TABLE_II1.
[5] OECD, “Corporate Tax Statistics,” 2020, https://www.oecd.org/tax/tax-policy/corporate-tax-statistics-second-edition.pdf.
[6] Stephen J. Entin, “The Tax Treatment of Capital Assets and Its Effect on Growth: Expensing, Depreciation, and the Concept of Cost Recovery in the Tax System.”
[7] This can be thought of as the opportunity cost of tying up the money in a particular investment. See Stephen J. Entin, “The Neutral Cost Recovery System: A Pro-Growth Solution for Capital Cost Recovery.”
[8] Stephen J. Entin, “The Tax Treatment of Capital Assets and Its Effect on Growth: Expensing, Depreciation, and the Concept of Cost Recovery in the Tax System.”
[9] Another—although slightly more complicated—way to achieve full cost recovery is a neutral cost recovery system. Under that system, write-offs are spread over time, but the deferred amounts are increased each year at a market interest rate to preserve a net present value equal to expensing. See Stephen J. Entin, “The Neutral Cost Recovery System: A Pro-Growth Solution for Capital Cost Recovery.”
[10] Stephen J. Entin, “The Tax Treatment of Capital Assets and Its Effect on Growth: Expensing, Depreciation, and the Concept of Cost Recovery in the Tax System.”
[11] Kevin A. Hassett and R. Glenn Hubbard, “Tax Policy and Business Investment,” in the Handbook of Public Economics 3 (2002), https://www.sciencedirect.com/science/article/pii/S1573442002800246.
[12] Stephen J. Entin, “The Tax Treatment of Capital Assets and Its Effect on Growth: Expensing, Depreciation, and the Concept of Cost Recovery in the Tax System.”
[13] Eric Zwick and James Mahon, “Tax Policy and Heterogeneous Investment Behavior,” American Economic Review 107:1 (January 2017), 217–248, https://www.aeaweb.org/articles?id=10.1257/aer.20140855.
[14] Giorgia Maffini, Jing Xing, and Michael P. Devereux, “The Impact of Investment Incentives: Evidence from UK Corporation Tax Returns,” American Economic Journal: Economic Policy 11:3 (August 2019), 361-89, https://www.aeaweb.org/articles?id=10.1257/pol.20170254.
[15] Yongzheng Liu and Jie Mao, “How Do Tax Incentives Affect Investment and Productivity? Firm-Level Evidence from China,” American Economic Journal: Economic Policy 11:3 (August 2019), 261-91, https://www.aeaweb.org/articles?id=10.1257/pol.20170478.
[16] Kevin A. Hassett and Kathryn Newmark, “Taxation and Business Behavior: A Review of the Recent Literature,” in John W. Diamond and George R. Zodrow, eds., Fundamental Tax Reform: Issues, Choices, and Implications (Cambridge, MA: MIT Press, 2008), 205.
[17] Id., at 206.
[18] Kyle Pomerleau, “Trading Longer Asset Lives for Lower Corporate Tax Rates in the United Kingdom,” Tax Foundation, Jan. 29, 2014, https://taxfoundation.org/trading-longer-asset-lives-lower-corporate-tax-rates-united-kingdom/.
[19] Ben Gardiner, Ron Martin, Peter Sunley, and Peter Tyler, “Spatially Unbalanced Growth in the British Economy,” Journal of Economic Geography 13:6 (November 2013), 889-928.
[20] The data shown in this report reflects capital allowances granted to all businesses regardless of size. Due to the revenue threshold, Australia’s accelerated depreciation and full expensing policies are not reflected in the data.
[21] Since the latter changes took place in 2021, they are not reflected in this report. (This report captures 2020 data.)
[22] For further analysis, see Kyle Pomerleau, “Economic and Budgetary Impact of Temporary Expensing,” Tax Foundation, Oct. 4, 2017, https://www.taxfoundation.org/economic-budgetary-impact-temporary-expensing/.
[23] OECD, “OECD Economic Surveys United States,” June 2018, https://read.oecd-ilibrary.org/economics/oecd-economic-surveys-united-states-2018_eco_surveys-usa-2018-en#page12.
[24] Department of Finance Canada, “Investing in Middle Class Jobs,” Fall Economic Statement 2018, https://budget.gc.ca/fes-eea/2018/docs/statement-enonce/fes-eea-2018-eng.pdf.
[25] Id.
[26] Kyle Pomerleau, “Economic and Budgetary Impact of Temporary Expensing;” and William Gbohoui, “Do Temporary Business Tax Cuts Matter? A General Equilibrium Analysis,” IMF, Feb. 15, 2019, https://www.imf.org/en/Publications/WP/Issues/2019/02/15/Do-Temporary-Business-Tax-Cuts-Matter-A-General-Equilibrium-Analysis-46524.
[27] The increases in 2018 and 2019 are mainly due to the introduction of temporary full expensing for machinery in Canada and the United States, as well as the reintroduction of capital allowances for industrial buildings in the United Kingdom.
[28] William McBride, “What is the Evidence on Taxes and Growth?” Tax Foundation, Dec. 18, 2012, https://taxfoundation.org/article/what-evidence-taxes-and-growth.
[29] OECD, “Table II.1. Statutory corporate income tax rate.”
[30] In 2015, Slovakia switched for buildings from its unique accelerated depreciation method to the straight-line method. It kept its accelerated method for machinery.
[31] Example: In the first year in the case of an asset with a useful life of six years, depreciation is 16.7% (100/6). The following years, the residual value is multiplied by two and divided by the remaining years of depreciation plus one year; i.e., for the second year: (100-16.7%) x 2 / (6-1+1) = 27.77%.
[32] EY, “Worldwide Capital and Fixed Assets Guide.”
[33] Council of the European Union, “Proposal for a Council Directive on a Common Corporate Tax Base (CCTB) ‒ State of play,” Interinstitutional File: 2016/0337, June 6, 2019, https://data.consilium.europa.eu/doc/document/ST-9676-2019-INIT/en/pdf.
[34] These are the depreciation schedules used to calculate the average CCTB allowance in this report: industrial buildings (4 percent or 25-year asset lives), machinery (20 percent or 5-year asset lives), and intangible assets (6.67 percent or 15-year asset lives).
[35] For a discussion of how CCTB would impact national governments’ use of depreciation allowances as a fiscal policy, see Kunka Petkova and Alfons Weichenrieder, “The relevance of depreciation allowances as a fiscal policy instrument: A hybrid approach to CCCTB?” Empirica 47 (April 2019), 579–610.
[36] Christoph Spengel, Rainer Bräutigam, Verena Dutt, Leonie Fischer, and Kathrin Stutzenberger, “The Impact of the CCTB on the Effective Tax Burden of Corporations: results from the Tax Analyzer Model,” European Commission, https://ec.europa.eu/taxation_customs/sites/taxation/files/taxation_paper_75.pdf, provides an insight into the impact CCTB would have on the effective corporate tax burdens in EU member states.


